


I've noticed the mainstream media, even local stations like Cha
I've noticed the mainstream media, even local stations like Cha


Joined:
X days ago
# Posts:
X,XXX
Contributor Points:
X
 FASTLANE:
This "Fastlane" discussion may cover sensitive, inflammatory, or controversial topics.
See Fastlane guidelines »
Replies:


#msg6032818Clloresch : Financially better off than when? Im like everyone else, i see my bills rising but most of it is the dang water and electricity rates and property taxes here! I think the truth is and always will be that things are never going to get cheaper, everything is going up. It always has. It always will.
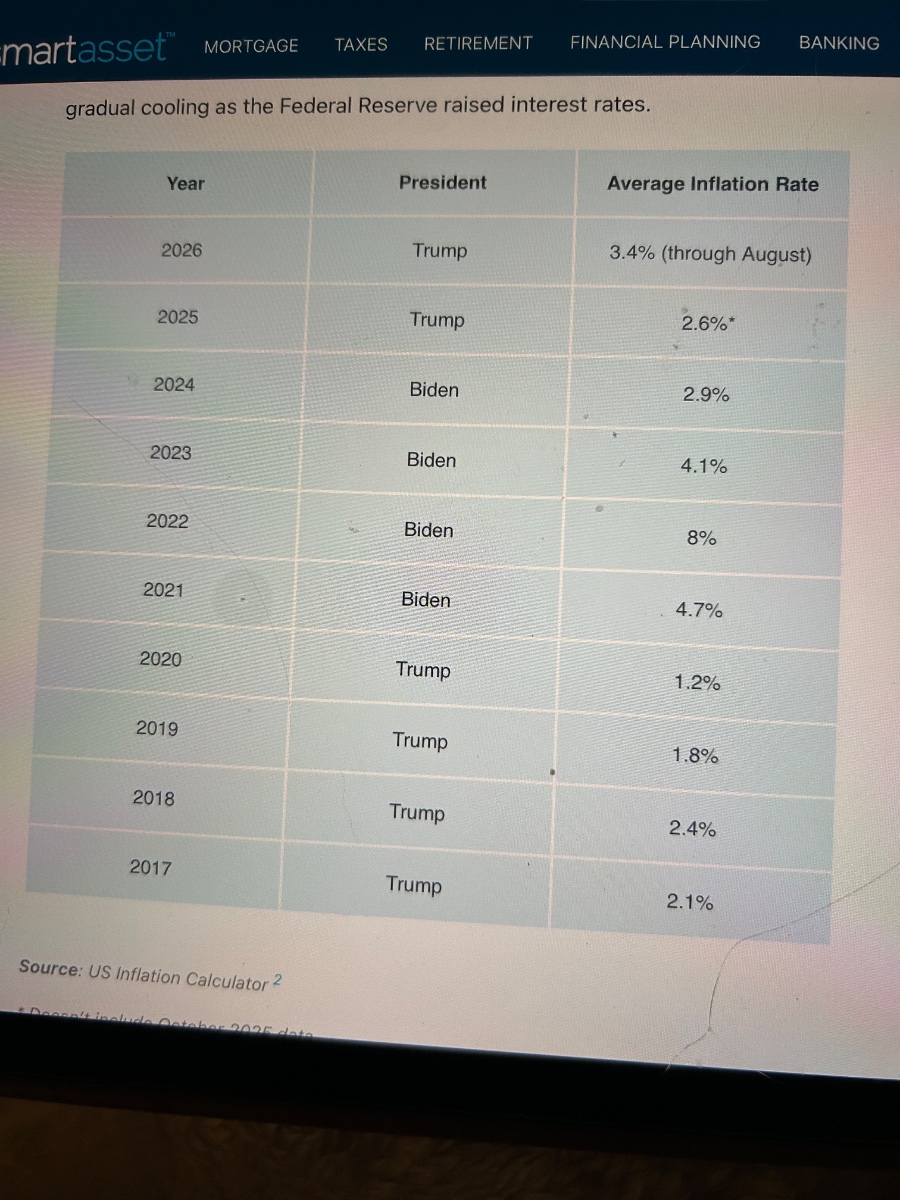
 MissAmericanPie : Correct highest cost for me is Electricity, which I get for less then most others. Water of all things so costly in COH and property taxes in Harris county. All will continue to cost more and more every year under Democrats. Without a six figure income, and multiple other incomes, good luck people. Some signed up for all this, Democrats, and they will continue to. There is only one option for lower cost, Republicans however both sides thinks it's them. It's not, its obvious when cost go up with massive inflation it's under Democrats just wait till the Socialist gain control they already have control of the Democrat party. 2020-2024 9% then under Republicans it will stabilize 3% 2024-2026 then we for some reason go back to the same people that cause it Democrats and cost go up. It's a cycle I don't understand. I'm on the final journey in life 2/3 completed so not much I can do about it and I'm enjoying life regardless of the cost.

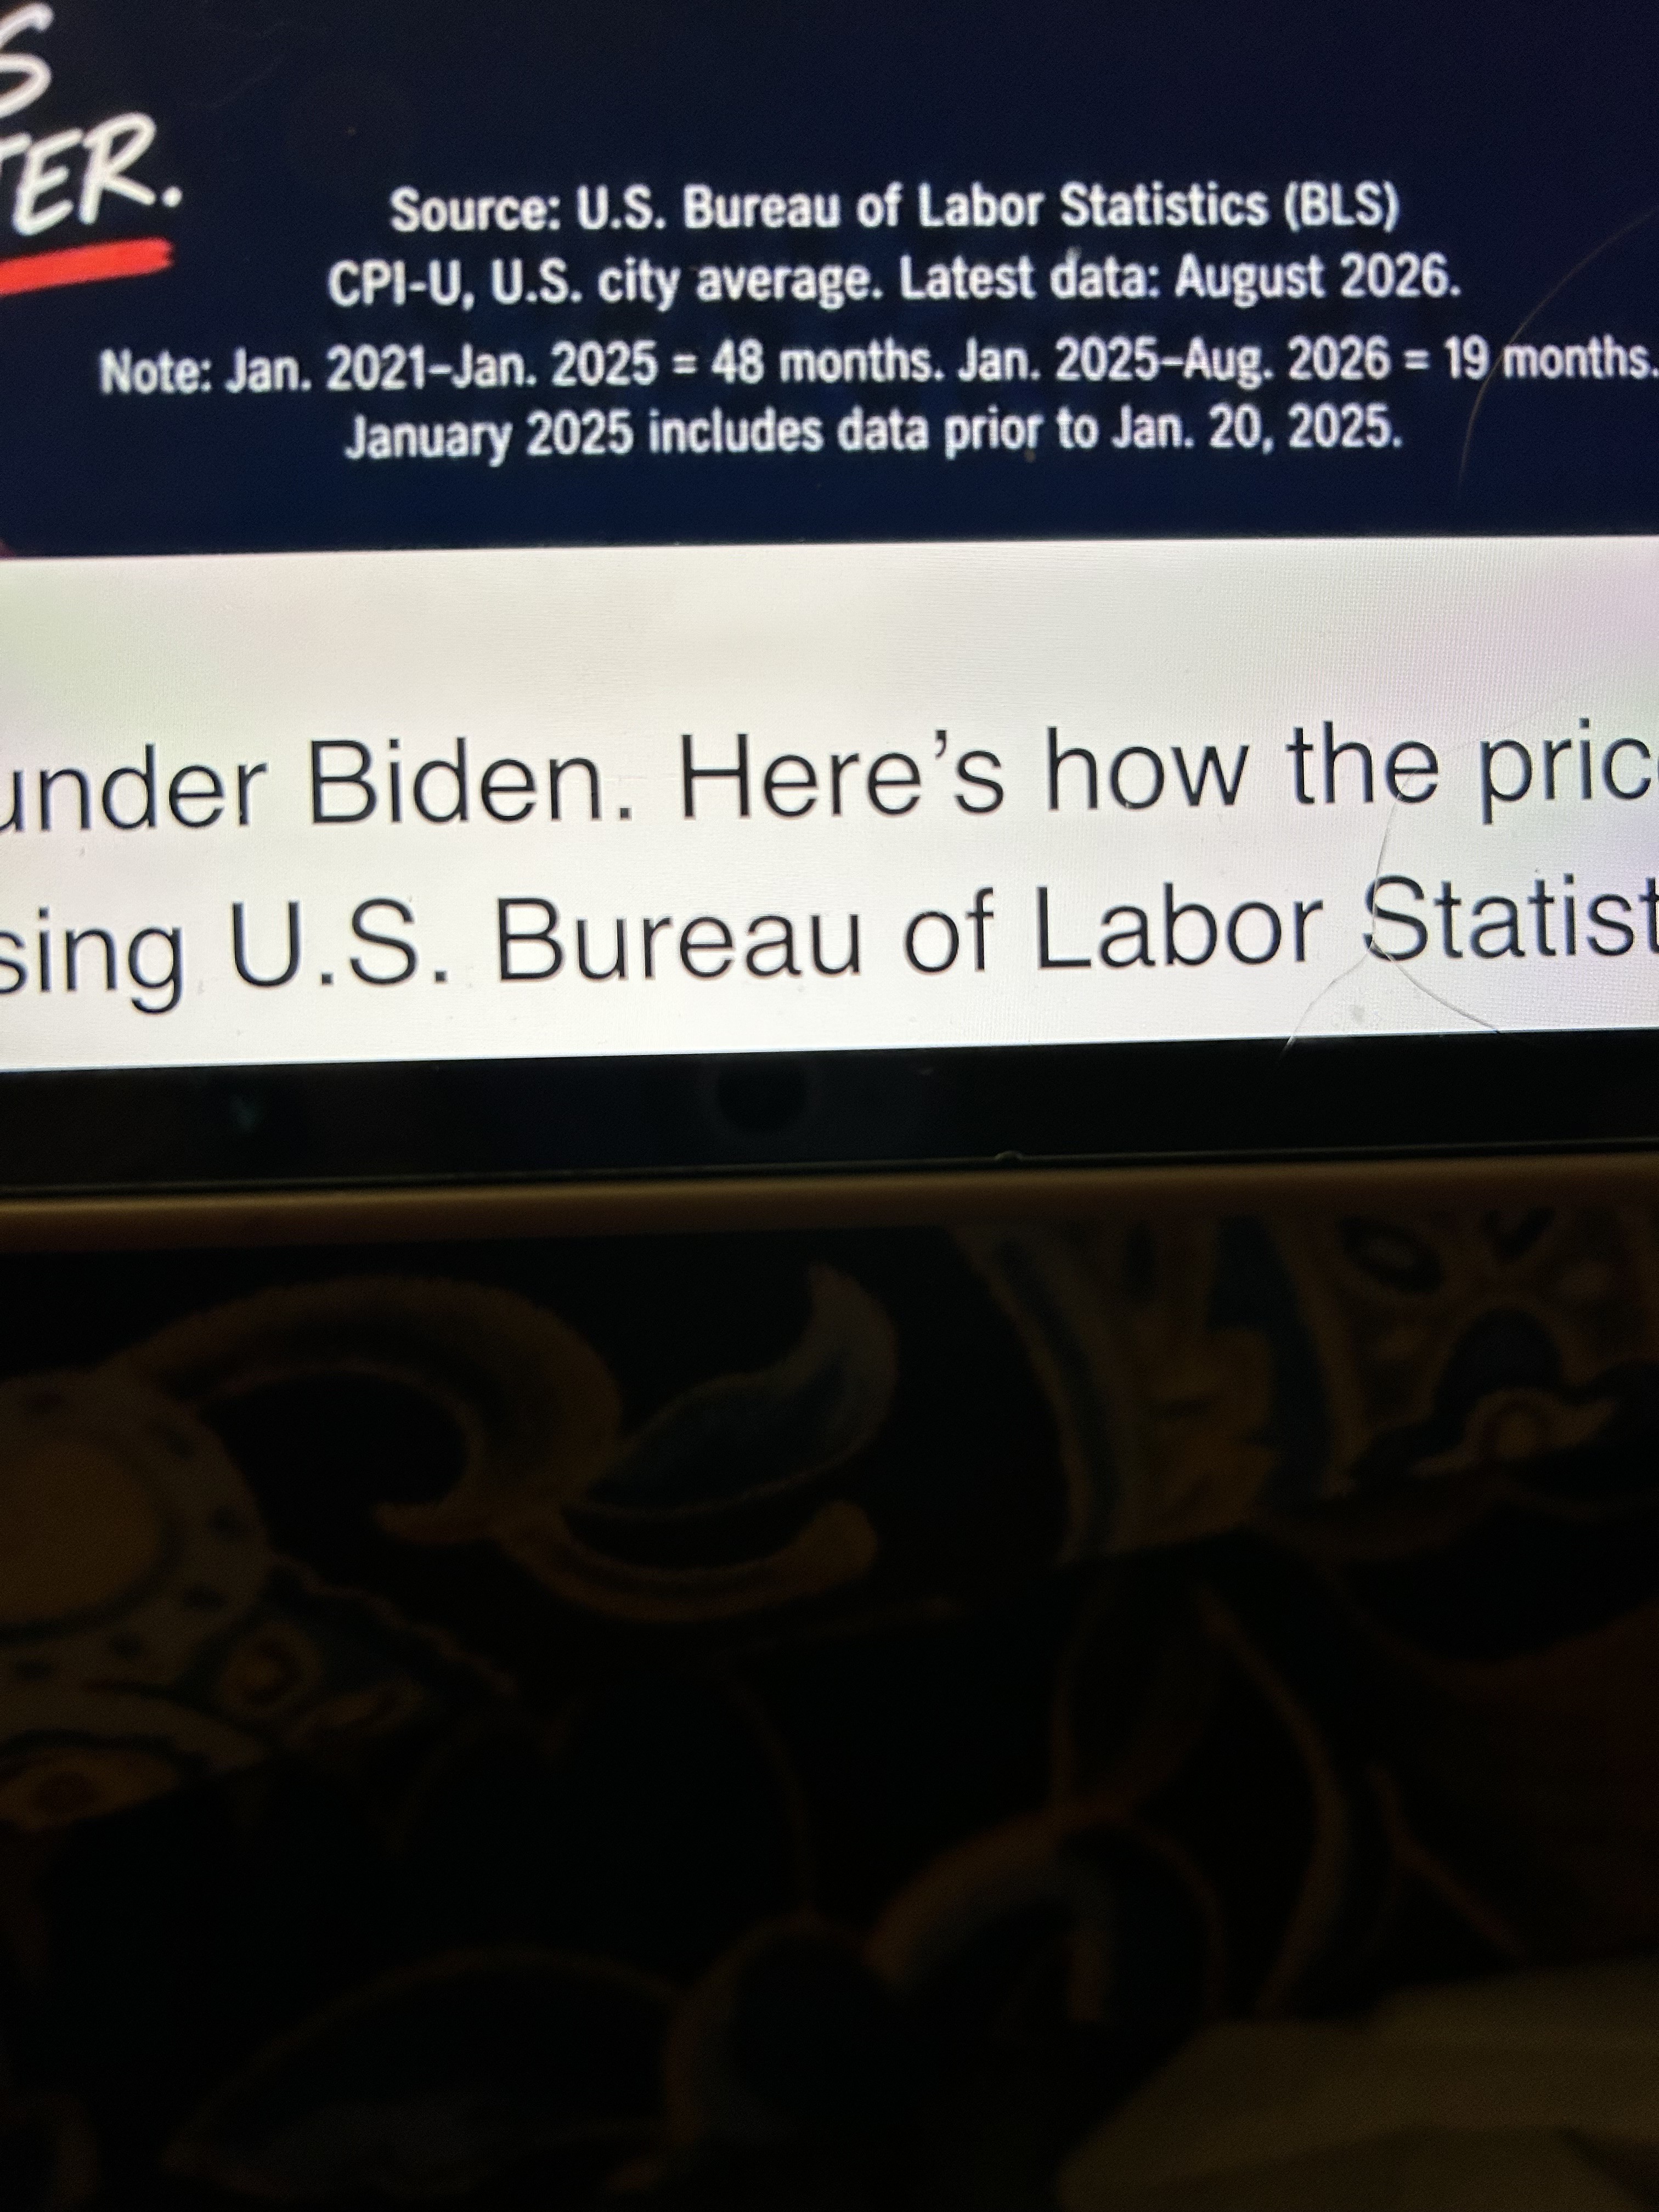
#msg6032785I've noticed the mainstream media, even local stations like Channel 2, doing story after story after story DAILY about inflation and grocery prices. Pushing that narrative that seems to suggest inflation is crippling people and ruining the economy. While prices are up and none of us enjoy this, is it really all that much worse now to warrant endless sob stories about how bad it is right before mid terms….hmmmm bc inflation under Biden was 9% friends… Ai Summary AI Summary Inflation rates during Joe Biden's presidency were significantly higher than those observed during Donald Trump's second term. Biden's inflation peaked at nearly 9% in mid-2022, while Trump's administration has seen moderating inflation rates, averaging around 3% since 2025. factually.co Inflation Comparison Overview Examining the inflation trends reveals key differences between the two administrations. Biden's Peak Inflation - Inflation reached approximately 9% in mid-2022 during Biden's presidency. Trump's Average Inflation - Under Trump, the average inflation rate from 2025 to present is around 3%. Economic Conditions - Biden's inflation was influenced by post-pandemic recovery and supply chain issues, while Trump's term has seen more stable economic conditions. Consumer Price Index (CPI) - The CPI during Biden's term showed a more volatile trend compared to the steadier rates under Trump. bidentotrump.com
MissAmericanPie : We discussed that a prompt can make all the difference when dealing with AI. Different AI different answer. Different prompt different answer. You place the blame on media but, using AI to support your answer is easy. It's built to spit out what you want from whatever you put in. So, let's put in a prompt with less confirmation bias cooked in.
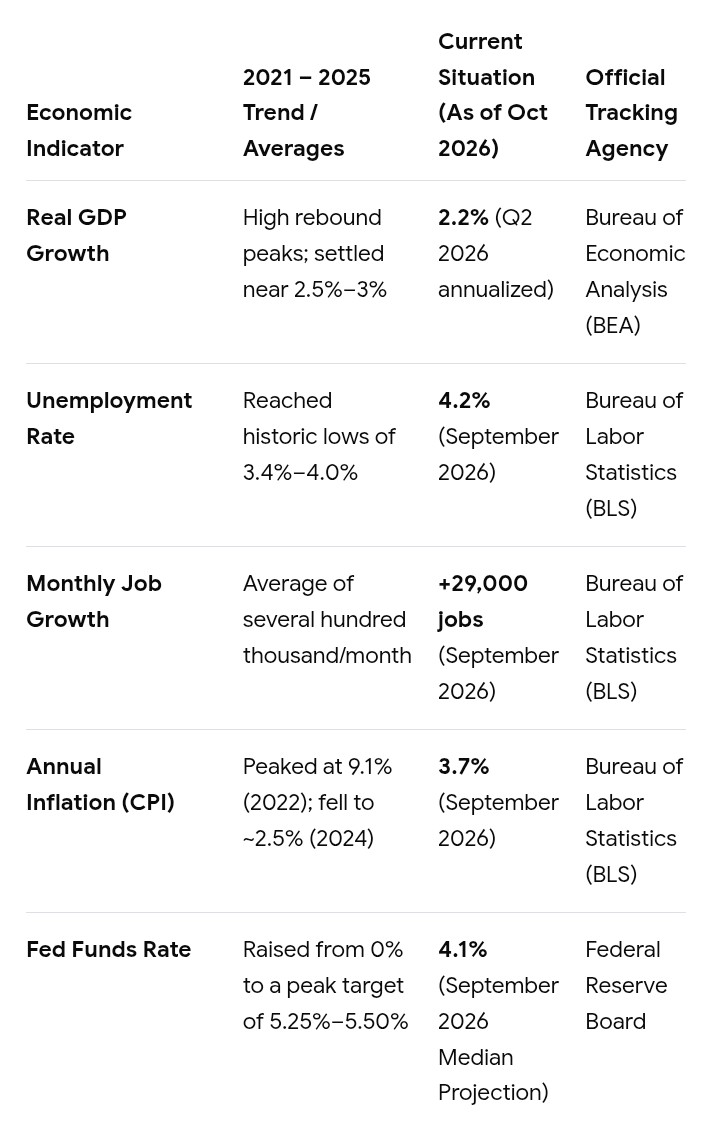
According to data published by the U.S. Bureau of Economic Analysis (BEA), the U.S. Bureau of Labor Statistics (BLS), and the Federal Reserve Board, here is how the core indicators compare:
• 2021-2025: Real Gross Domestic Product (GDP) experienced a highly volatile post-pandemic rebound, expanding at an annual rate of 5.8% in 2021 before stabilizing to around 2.5% to 3.0% by late 2024 and 2025.
• Current Economy (2026): According to the U.S. Bureau of Economic Analysis (BEA), real GDP increased at an annualized rate of 2.5% in the first quarter and 2.2% in the second quarter of 2026. This indicates that the broader economy is growing steadily, though slightly slower than the peak post-pandemic boom years.
• 2021-2025: This period was marked by a rapid labor market recovery. The unemployment rate dropped from over 6% in early 2021 to multi-decade lows, largely fluctuating between 3.4% and 4.0%.
• Current Economy (2026): Data from the U.S. Bureau of Labor Statistics (BLS) shows a cooling labor market. The national unemployment rate stood at 4.2% in September 2026. While historically low, it has ticked upward from its 2022-2023 lows. Furthermore, net job creation has slowed significantly, with nonfarm payroll employment adding only 29,000 jobs in September 2026 amid low monthly hiring rates.
• Current Economy (2026): Price pressures have seen a modest resurgence. The BLS September 2026 Consumer Price Index reported that annualized CPI inflation rose to 3.7% over the previous 12 months. This reflects a stubborn upward drift from the lows seen at the end of the 2021-2025 cycle, driven significantly by a 20.4% year-over-year surge in energy costs.
Conclusion
By official metrics, the current 2026 economy is not in a technical recession, and real output continues to expand at a steady pace. However, compared to the latter half of the 2021-2025 window, the current climate shows signs of increased friction: inflation has drifted back up above the Fed's target, and a "low-hire" environment has emerged, meaning finding a job has become incrementally harder even though mass layoffs remain low.
MissAmericanPie : Now, we will use it again to find out another question.
Based on official, verified data from federal statistical agencies-including the U.S. Bureau of Labor Statistics (BLS), the U.S. Department of Agriculture (USDA), the Federal Reserve Board, and the National Association of Insurance Commissioners (NAIC)-the current cost-of-living pressures are driven by a distinct mix of structural supply deficits, geopolitical commodity shocks, and rising baseline corporate input costs.
According to the USDA Economic Research Service (ERS), grocery (food-at-home) prices are up roughly 2.4% year-over-year as of late 2026. The foundational drivers include:
• Severe Cattle Inventory Deficits: Low national cattle inventories have severely constrained domestic supply, pushing specific proteins like uncooked ground beef up 20% over recent baselines.
• Agricultural Yield Shocks: Low Sierra Nevada snowpack and localized extreme weather patterns have negatively impacted fruit, vegetable, and dairy yields out of primary growing regions like California.
• Freight and Energy Overhead: Persistent labor turnover and high long-haul and refrigerated trucking rates keep the logistics of food transport exceptionally expensive.
• Packaging Tariff Pass-Through: Elevated 50% metal tariffs on aluminum and steel have inflated manufacturing and canning packaging costs, which are passed down to consumer retail shelves.
The U.S. Bureau of Labor Statistics (BLS) reports that shelter costs alone have been the single largest driver of core inflation over the past year, responsible for roughly two-fifths of total inflation. Data from the Federal Reserve outlines two massive structural imbalances:
• The "Rate Lock-In" Supply Freeze: Because the Federal Reserve rapidly raised benchmark interest rates to combat inflation, millions of existing homeowners have 3% to 4% fixed-rate mortgages. Selling their homes would mean taking on a new mortgage at 6% to 7.5%, creating a severe deficit in existing home inventory.
• Regulatory and Material Backlogs: Multi-family construction and affordable zoning initiatives lag significantly behind national population demand due to restrictive local density regulations, high raw construction material inputs, and expensive builder financing costs.
Data compiled by state regulators via the National Association of Insurance Commissioners (NAIC) and health program tracking indicates that premiums are rising due to surging back-end liabilities:
• Property Insurance Drivers: Homeowners' premiums have escalated rapidly due to increased catastrophe losses from localized severe weather events (hurricanes, wildfires, and convective storms). This has driven up the cost of "reinsurance" (the insurance that insurance companies buy to protect themselves). Additionally, the localized cost of construction labor and replacement materials to rebuild damaged homes has surged.
• Health Insurance Drivers: Health insurance premiums are responding directly to rising out-of-pocket medical delivery costs, higher utilization of advanced clinical therapies, and the expiration of pandemic-era federal premium subsidy caps, forcing baseline plan adjustments upward.
Energy costs have seen a severe cyclical resurgence, with the BLS recording a 14.7% annualized spike in consumer energy indexes:
• Geopolitical Fuel Shock: Ongoing conflict in the Middle East has disrupted critical transit corridors like the Strait of Hormuz, driving Brent crude oil prices significantly higher and directly inflating consumer gasoline and heating fuel.
• The Tech Infrastructure Grid Strain: On the electricity side, utility providers have experienced a sharp uptick in aggregate demand. The massive, nationwide rollout of artificial intelligence data centers is consuming unprecedented amounts of grid power, causing utility companies to raise electricity rates to fund infrastructure expansion.
When aggregated by the Federal Reserve and the BLS, the broader American cost of living is suffering from a "Triple Supply Shock":
• Tariffs and Import Costs: Higher import tariffs on raw components have created structural cost-push inflation across domestic manufacturing.
• Sticky Service Wages: While general job hiring has cooled significantly, corporate wage growth for internal staff is still holding at roughly 3%. Because wages are the single largest input cost for consumer service businesses (dry cleaning, repair, auto services, and transportation), these baseline operations must keep prices elevated to protect operating margins.
 Sophos3 : ive specified this subject is about what the media choses to focus on. The only reason im even bringing up Presidents is bc they are representative of economic terms as well. The media didnt push the terrible 9% inflation when it hit that historic high. Some on here still cant believe it was that bad….why? Bc it wasnt the focus of the media. But it is what it is.
 MissAmericanPie :
When people complained about me using AI in he past they thought I cut/paste my posts, had it do my thinking for me, or some other such nonsense. When I did use it, I did things like ask it the links of least bias sources for data, soften my language, make my posts more concise, or even check my work to see if I was unintentionally being offensive or inaccurate in someway. Depending on the amount of social social masking/behavioural monitoring, unfiltered sensory overload, the cognitive friction of unexpected task switching, and the constant manual decoding of ambiguous neurotypical social cuesI have during day to day reality/online I burn out. I start to exhibit deficits. Just sharing this for the class. I've tried to explain this in a variety of ways but, AI is a tool. Use it as a guide, a form of measure, not something to further deepen a confirmation bias. Anyhow, just to hammer the point home. Let's ask AI one last question.
"Using only official verified accurate data sources who's fault are the current problems and the current state of the U.S. Is in, Biden or Trump? Use no media as sources. Create the answer in no longer than three sentences and use percentages to asign blame. No exceptions."
#msg6033096Sophos3 : ive specified this subject is about what the media choses to focus on. The only reason im even bringing up Presidents is bc they are representative of economic terms as well. The media didnt push the terrible 9% inflation when it hit that historic high. Some on here still cant believe it was that bad….why? Bc it wasnt the focus of the media. But it is what it is.
MissAmericanPie : Are you sure the media didn't push stories or are you forgetting they did? Would you like a sample?
Sophos3 : I checked several sources. Why do you deny inflation was WORSE under Biden??
#msg6033102Sophos3 : I checked several sources. Why do you deny inflation was WORSE under Biden??
MissAmericanPie : I didn't. You are the one making that point. It was also better at a different point. I even said as much. Did you look at the variety of data I posted or just glance over it? Your initial post was stating the media didn't focus on Biden as much and made it sound like it was a media issue and not a actual issue today.

|
High inflation, high profits, higher stock return and interest on borrowed money, wages lag inflation. The younger generations and poor suffer more. Lived this cycle many times.
Sophos3 reacted
MissAmericanPie : Wanna discuss the BLS' mountain of data? One could say I live off its nooks and crannies and how it applies to the DOT,ONET and acompanyibg publications. BLS data in a vacuum is virtually meaningless.
MissAmericanPie : The thing about inflation is that it is a rate of increase, but what people feel is the effects compounded inflation on prices over time. We went through a bout of it with COVID (like every other developed country). Now we're going through another bout due to tariffs and the war in Iran. It is a one-two punch.
MissAmericanPie : The thing about inflation is that it is a rate of increase, but what people feel is the effects compounded inflation on prices over time. We went through a bout of it with COVID (like every other developed country). Now we're going through another bout due to tariffs and the war in Iran. It is a one-two punch.
 Clloresch tipped
 LemonEye 500 credits for a post in this forum discussion.
LemonEye :
To make his inflation statistically lower his Bureau of E conomic Affairs cha.nged what is in the basket used to compute the Personal Consumption Expenditures.
I wish !
MissAmericanPie would address how that is not newsworthy or unworthy of even mention in her dissertations. IMO, it is at a minimum worthy of a mention.
FASTLANE:
This "Fastlane" discussion may cover sensitive, inflammatory, or controversial topics.
See Fastlane guidelines »
Views: 2,539
# Replies: 120